The CONFIDENCE.T function returns the confidence interval for a population mean, using a student’s t distribution.
Syntax:= CONFIDENCE.T(alpha,standard_dev,size)
The CONFIDENCE.T function syntax has the following arguments:
- Alpha Required. The significance level used to compute the confidence level. The confidence level equals 100*(1 – alpha)%, or in other words, an alpha of 0.05 indicates a 95 percent confidence level.
- Standard_dev Required. The population standard deviation for the data range and is assumed to be known.
-
Size Required. The sample size.
Example: Let’s look at some Excel CONFIDENCE.T function examples and explore how to use the CONFIDENCE.T function as a worksheet function in Microsoft Excel:
In the spreadsheet below, the Excel Confidence.Norm Function is used to calculate the confidence interval, with a significance of 0.05 (i.e. a confidence level of 95%), for the mean of a sample of heights of 200 men. The sample mean is 1.75 meters and the standard deviation is 0.08 meters.

Syntax: =CONFIDENCE.T(B1,B2,B3)
Result: 0.011155071
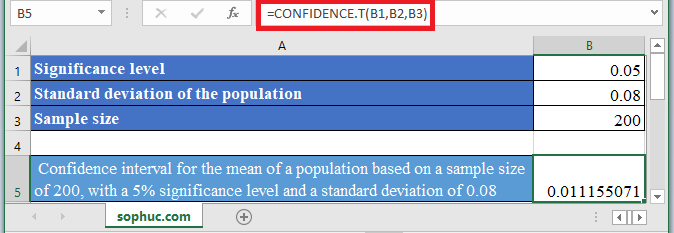
The above function returns a confidence value of 0.011155071
Therefore the confidence interval is 1.75 ± 0.011155071, which is equal to:
1.738844929 to 1.761155071
Note:
- if any argument is non-numeric, CONFIDENCE.T returns the #VALUE! error value
- if alpha is ≤ 0 or ≥ 1, CONFIDENCE.T returns the #NUM! error value
- if standard_dev ≤ 0, CONFIDENCE.T returns the #NUM! error value
- if size is not an integer, it is truncated
- if size < 1, CONFIDENCE.T returns the #DIV/0! error value